3QFY2018 Result Update | Cable
February 14, 2018
Century Plyboards India
BUY
CMP
`298
Performance Update
Target Price
`400
Y/E March (` cr)
3QFY18
3QFY17
% yoy
2QFY18
% qoq
Investment Period
12 month
Net sales
510
459
11.2
475
7.5
Sector
Plywood
EBITDA
88
67
30.2
74
18.5
Market Cap (Rs cr)
6,643
EBITDA margin (%)
17.2%
14.7%
15.6%
Net Debt
545
Adjusted PAT
47
37
25.1
40
16.2
Beta
0.9
Source: Company, Angel Research
52 Week High / Low
363/213
For 3QFY2018, Century Plyboards India Ltd (CPIL) posted results in-line with our
Avg. Daily Volume
36,577
Face Value (Rs)
10
expectations on both top-line as well as bottom-line fronts. Revenues grew by
BSE Sensex
34,196
~11% yoy and operating margins were also higher yoy. On the bottom-line front,
Nifty
10,498
Reuters Code
CNTP.BO
CPIL reported growth of ~25% yoy to `47cr on the back of strong top-line growth
Bloomberg Code
CPBI.IN
and lower interest cost.
Top-line driven by healthy volume growth: The company’s top-line grew by ~11%
Shareholding Pattern (%)
yoy to `510cr on the back of healthy growth in volumes. Considering the
Promoters
72.0
segments, the company’s plywood, laminate & particle Board segment reported
MF / Banks / Indian Fls
4.7
flat growth. During the quarter, the company had started selling MDF, which
FII / NRIs / OCBs
11.5
reported ~`48cr. The logistics segment reported ~37% growth.
Indian Public / Others
11.8
Healthy revenues and lower interest cost aided overall profitability: On the
operating front, the company’s margin improved by 252bps yoy on the back of
Abs. (%)
3m
1yr
3yr
MDF contribution in total revenue, which is a higher margin business. The
Sensex
3.0
22.2
20.5
company reported ~25% yoy rise in its net profit to `47cr on the back of healthy
CPIL
6.8
41.5
60.0
revenue growth and lower interest cost.
Outlook and Valuation: We expect CPIL to report net revenue CAGR of ~17% to
~`2,896cr over FY2017-20E owing to healthy growth in plywood and lamination
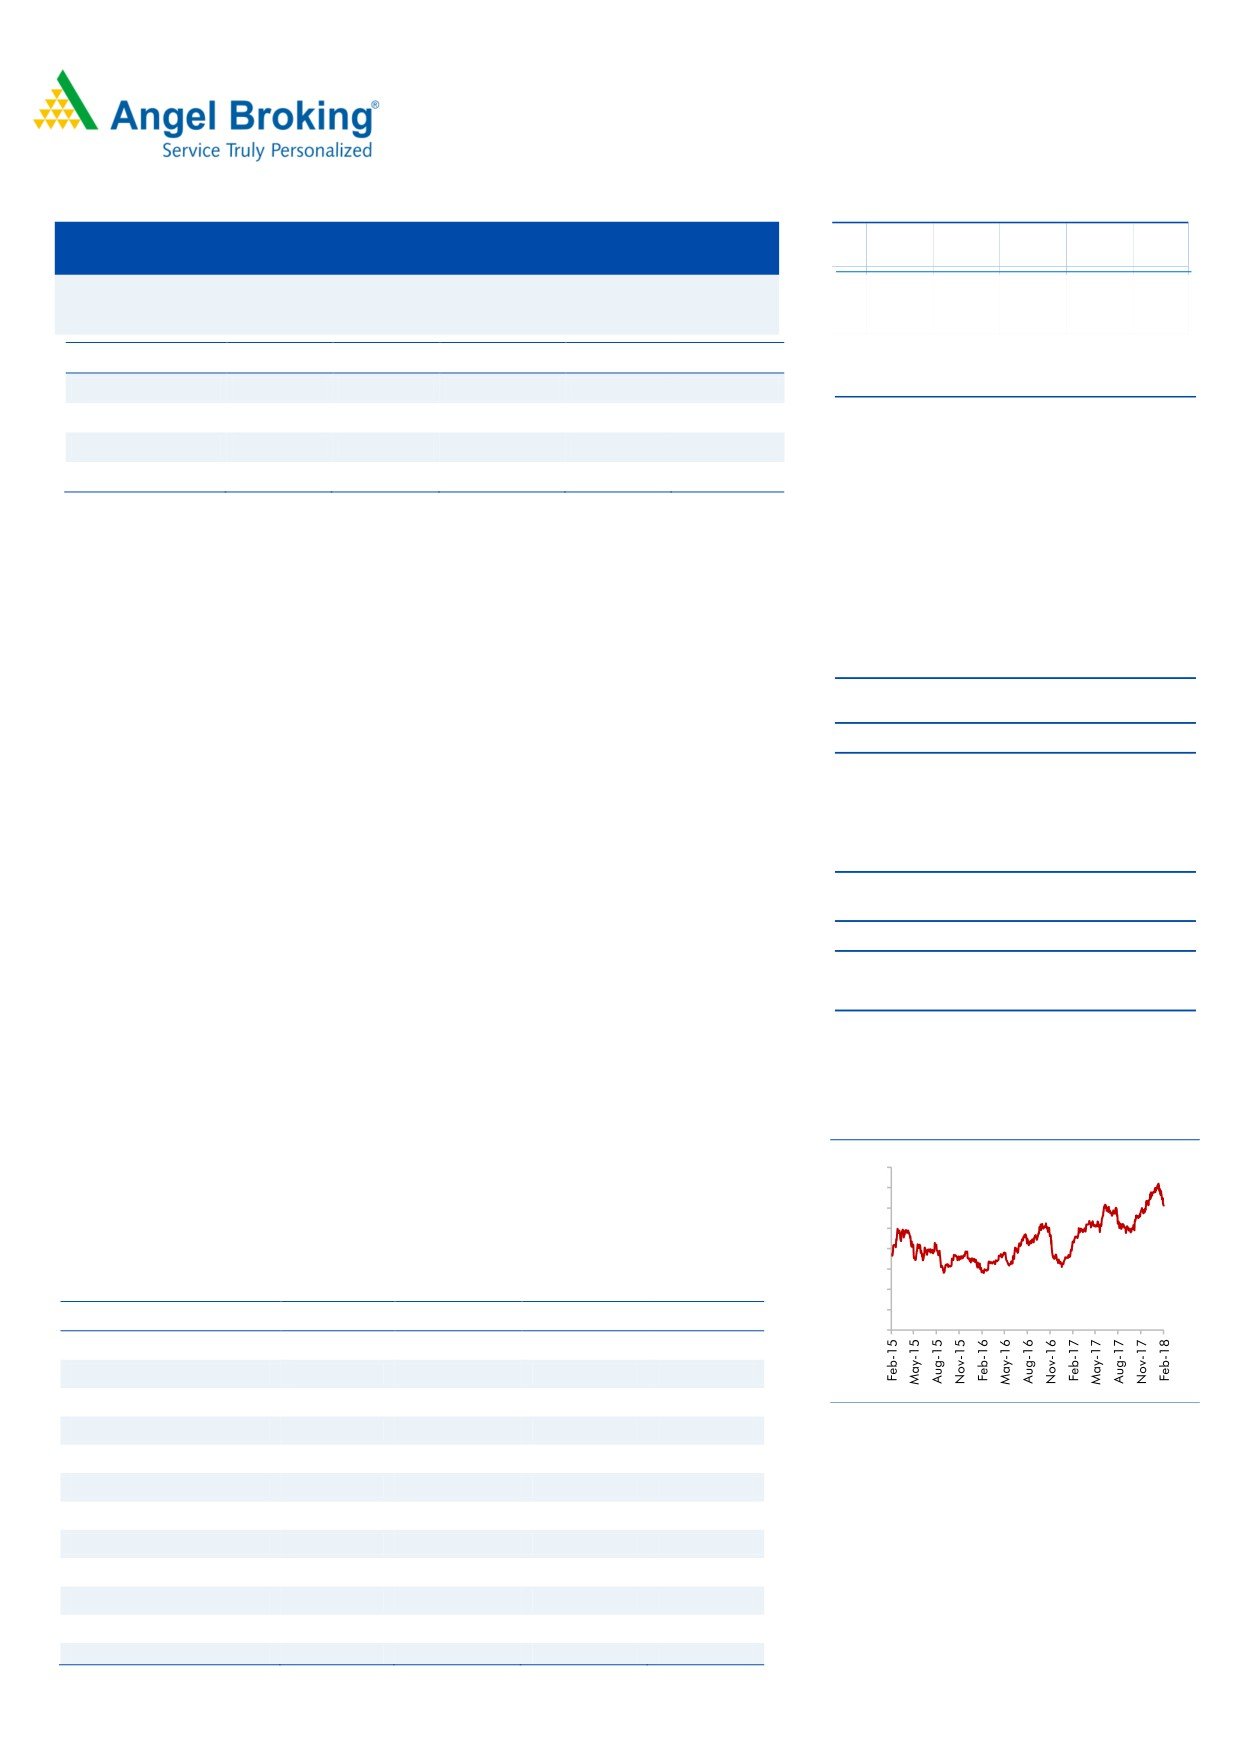
Historical share price chart
business, foray into MDF and particle boards coupled with strong brand and
400
distribution network. On the bottom-line front, we expect CAGR of ~16% to
350
300
`306cr over the same period on the back of strong revenue and better margins in
250
MDF business. We maintain our BUY rating on the stock with target price of `400.
200
150
Key Financials
100
50
Y/E March (` cr)
FY2017
FY2018E
FY2019E
FY2020E
0
Net sales
1,819
2,007
2,510
2,896
% chg
10.8
10.4
25.1
15.4
Adj. Net profit
193
188
248
306
Source: Company, Angel Research
% chg
14.0
(2.9)
31.9
23.4
EBITDA margin (%)
17.2
17.5
17.9
18.1
Amarjeet S Maurya
EPS (`)
8.7
8.4
11.1
13.7
022-40003600 Ext: 6831
P/E (x)
34.3
35.3
26.8
21.7
P/BV (x)
9.3
7.5
6.1
5.0
RoE (%)
27.1
21.3
22.9
22.9
RoCE (%)
18.9
17.1
20.2
21.3
EV/Sales (x)
3.9
3.7
2.9
2.5
EV/EBITDA (x)
23.0
21.0
16.4
13.9
Source: Company, Angel Research Note: CMP as of February 06, 2018
Please refer to important disclosures at the end of this report
1
Century Plyboards India| 3QFY2018 Result Update
Exhibit 1: 3QFY2018 Performance
Y/E March (` cr)
3QFY18
3QFY17
% yoy
2QFY18
% qoq
9MFY18
9MFY17
% chg
Net Sales
510
459
11.2
475
7.5
1,458
1,394
4.5
Consumption of RM
261
220
18.5
254
2.4
749
665
12.6
(% of Sales)
51.1
48.0
53.6
51.4
47.7
Staff Costs
72
64
13.4
68
6.9
209
190
9.9
(% of Sales)
14.2
13.9
14.2
14.3
13.6
Other Expenses
89
108
(17.1)
78
13.7
277.18
331
(16.3)
(% of Sales)
17.5
23.4
16.5
19.0
23.7
Total Expenditure
422
391
7.9
401
5.4
1,235
1,186
4.1
Operating Profit
88
67
30.2
74
18.5
223
208
7.0
OPM
17.2
14.7
15.6
15.3
14.9
Interest
6.3
11.2
(44.0)
7.9
(20.9)
20
26
(21.5)
Depreciation
26.3
14.9
76.0
13.8
90.3
53
37
44.8
Other Income
4
3
1
5
8
PBT (excl. Ext Items)
59
44
33.6
53
12.3
154
154
0.4
Ext (Income)/Expense
PBT (incl. Ext Items)
59
44
33.6
53
12.3
154
154
0.4
(% of Sales)
11.7
9.7
11.2
10.6
11.0
Provision for Taxation
13
7
13
34
24
(% of PBT)
21.5
16.1
24.2
21.7
15.7
Reported PAT
47
37
25.1
40
16.2
121
130
(6.7)
Source: Company, Angel Research
Exhibit 2: 3QFY2018 Segment Revenue Performance
Y/E March (` cr)
3QFY18
3QFY17
% yoy
2QFY18
% qoq
9MFY18
9MFY17
% chg
Plywood & allied products
322.7
323.5
(0.2)
306
5.5
971
982
(1.1)
Laminate & allied products
99.9
99.4
0.5
125
(19.9)
314
302
3.7
Medium density Fibre board
47.6
0.4
-
0
-
48
3
-
Particle Board
10.0
10.3
(2.4)
14
(30.8)
36
13
164.2
Container Frieght Station Services
27.6
20.2
36.6
25
10.3
76
65
17.7
Others
7.5
8.2
(8.1)
11
(32.0)
28
34
(18.8)
Total Segment Revenue
515
462
11.6
481.1
7.1
1473
1400
5.2
Less: Inter segment Revenue
5
3
6.6
15
5
Gross Sales
510
459
11.2
474.6
7.5
1458
1394
4.5
Source: Company, Angel Research
February 14, 2018
2
Century Plyboards India| 3QFY2018 Result Update
Outlook and Valuation
We expect CPIL to report net revenue CAGR of ~17% to ~`2,896cr over FY2017-
20E owing to healthy growth in plywood and lamination business, foray into MDF
and particle boards coupled with strong brand and distribution network. On the
bottom-line front, we expect CAGR of ~16% to `306cr over the same period on
the back of strong revenue and better margins in MDF business. We maintain our
BUY rating on the stock with target price of `400.
Downside risks to our estimates
Most of the company’s raw materials are imported from other countries,
and considering that the company has ECB loans, any unfavorable
change in currency may pose forex risks, which could significantly impact
margins.
Recently, the company has added a new MDF plant with capex of `380cr,
any slowdown in MDF market can impact the company’s earnings due
higher fixed cost overheads.
Company Background
Century Plyboards (India) Ltd (CPIL) is a plywood manufacturer. The company's
segments include plywood, laminate, CFS services and others. The company's
geographical segments are India and overseas. The plywood segment includes
plywood, block-board, veneer and timber. The laminate segment includes
decorative laminates and pre-laminated boards. The CFS services segment
includes container freight station services. The others segment includes mainly
trading of chemicals, minerals, readymade furniture and equipments. The
company's product portfolio includes doors, decorative veneer, new age products
(NAP), fiber cement boards, particle boards, look book, slimline, mono core,
magnetic laminates and prelaminated boards. CPIL is also engaged in the logistics
business through the management of a container freight station. The Company's
units are spread across India in Joka (West Bengal), Guwahati (Assam), Kandla
(Gujarat), Chennai (Tamil Nadu) and Karnal (Haryana).
February 14, 2018
3
Century Plyboards India| 3QFY2018 Result Update
Profit & Loss Statement
Y/E March (` cr)
FY2016
FY2017
FY2018E
FY2019E
FY2020E
Total operating income
1,641
1,819
2,007
2,510
2,896
% chg
3.3
10.8
10.4
25.1
15.4
Total Expenditure
1,351
1,507
1,656
2,061
2,372
Raw Material
819
895
987
1,235
1,425
Personnel
236
273
307
389
455
Others Expenses
296
339
361
437
492
EBITDA
289
312
351
449
524
% chg
7.1
7.8
12.6
27.9
16.6
(% of Net Sales)
17.6
17.2
17.5
17.9
18.1
Depreciation& Amortisation
47
59
67
75
77
EBIT
242
253
284
374
447
% chg
9.1
4.4
12.6
31.6
19.5
(% of Net Sales)
14.7
13.9
14.2
14.9
15.4
Interest & other Charges
48
30
55
70
70
Other Income
6
23
8
9
10
(% of PBT)
3.0
9.2
3.4
2.9
2.6
Share in profit of Associates
-
-
-
-
-
Recurring PBT
200
245
238
314
387
% chg
11.5
22.4
(2.9)
31.9
23.4
Tax
30
52
50
66
81
(% of PBT)
15.2
21.0
21.0
21.0
21.0
PAT (reported)
170
193
188
248
306
Minority Interest (after tax)
-
-
-
-
-
Profit/Loss of Associate Company
-
-
-
-
-
ADJ. PAT
170
193
188
248
306
% chg
13.9
14.0
(2.9)
31.9
23.4
(% of Net Sales)
10.3
10.6
9.4
9.9
10.6
Basic EPS (`)
7.6
8.7
8.4
11.1
13.7
Fully Diluted EPS (`)
7.6
8.7
8.4
11.1
13.7
% chg
13.9
14.0
(2.9)
31.9
23.4
February 14, 2018
4
Century Plyboards India| 3QFY2018 Result Update
Balance Sheet
Y/E March (` cr)
FY2016
FY2017
FY2018E FY2019E FY2020E
SOURCES OF FUNDS
Equity Share Capital
22
22
22
22
22
Reserves& Surplus
507
693
858
1,062
1,312
Shareholders Funds
529
715
881
1,084
1,334
Minority Interest
9
12
12
12
12
Total Loans
474
619
780
770
770
Deferred Tax Liability
1
1
1
1
1
Total Liabilities
1,013
1,347
1,674
1,867
2,118
APPLICATION OF FUNDS
Gross Block
298
412
924
948
973
Less: Acc. Depreciation
48
106
173
248
325
Net Block
250
306
751
700
648
Capital Work-in-Progress
102
299
299
299
299
Investments
6
6
6
6
6
Current Assets
751
905
836
1,139
1,480
Inventories
298
301
330
426
500
Sundry Debtors
284
342
379
488
571
Cash
39
67
34
46
96
Loans & Advances
90
160
60
138
261
Other Assets
39
35
32
40
52
Current liabilities
162
238
286
345
385
Net Current Assets
588
667
549
793
1,095
Deferred Tax Asset
66
69
69
69
69
Mis. Exp. not written off
-
-
-
-
-
Total Assets
1,013
1,347
1,674
1,867
2,118
February 14, 2018
5
Century Plyboards India| 3QFY2018 Result Update
Consolidated Cashflow Statement
Y/E March (` cr)
FY2016
FY2017
FY2018E FY2019E FY2020E
Profit before tax
200
245
238
314
387
Depreciation
47
59
67
75
77
Change in Working Capital
34
(54)
84
(232)
(251)
Interest / Dividend (Net)
47
30
55
70
70
Direct taxes paid
(47)
(43)
(50)
(66)
(81)
Others
10
(17)
0
0
0
Cash Flow from Operations
293
221
394
160
202
(Inc.)/ Dec. in Fixed Assets
(150)
(305)
(512)
(24)
(25)
(Inc.)/ Dec. in Investments
11
0
0
0
0
Cash Flow from Investing
(139)
(304)
(512)
(24)
(25)
Issue of Equity
0
0
0
0
0
Inc./(Dec.) in loans
(44)
142
162
(10)
0
Dividend Paid (Incl. Tax)
(50)
(0)
(22)
(45)
(56)
Interest / Dividend (Net)
(59)
(30)
(55)
(70)
(70)
Cash Flow from Financing
(153)
112
85
(124)
(126)
Inc./(Dec.) in Cash
1
28
(33)
12
51
Opening Cash balances
37
39
67
34
46
Closing Cash balances
39
67
34
46
96
February 14, 2018
6
Century Plyboards India| 3QFY2018 Result Update
Key Ratios
Y/E March
FY2016
FY2017
FY2018E FY2019E FY2020E
Valuation Ratio (x)
P/E (on FDEPS)
39.1
34.3
35.3
26.8
21.7
P/CEPS
30.5
26.2
26.0
20.5
17.3
P/BV
12.5
9.3
7.5
6.1
5.0
Dividend yield (%)
0.8
0.8
0.3
0.7
0.8
EV/Sales
4.3
3.9
3.7
2.9
2.5
EV/EBITDA
24.4
23.0
21.0
16.4
13.9
EV / Total Assets
7.0
5.3
4.4
3.9
3.4
Per Share Data (Rs)
EPS (Basic)
7.6
8.7
8.4
11.1
13.7
EPS (fully diluted)
7.6
8.7
8.4
11.1
13.7
Cash EPS
9.8
11.4
11.4
14.5
17.2
DPS
2.2
2.5
1.0
2.0
2.5
Book Value
23.8
32.1
39.6
48.7
60.0
Returns (%)
ROCE
24.1
18.9
17.1
20.2
21.3
Angel ROIC (Pre-tax)
25.3
20.0
17.6
20.8
22.3
ROE
32.1
27.1
21.3
22.9
22.9
Turnover ratios (x)
Asset Turnover (Gross Block)
5.5
4.4
2.2
2.6
3.0
Inventory / Sales (days)
66
60
60
62
63
Receivables (days)
63
69
69
71
72
Payables (days)
19
28
31
31
31
Working capital cycle (ex-cash) (days)
110
101
98
102
104
Source: Company, Angel Research
February 14, 2018
7
Century Plyboards India| 3QFY2018 Result Update
Research Team Tel: 022 - 39357800
DISCLAIMER
This document is solely for the personal information of the recipient, and must not be singularly used as the basis of any investment
decision. Nothing in this document should be construed as investment or financial advice. Each recipient of this document should
make such investigations as they deem necessary to arrive at an independent evaluation of an investment in the securities of the
companies referred to in this document (including the merits and risks involved), and should consult their own advisors to determine
the merits and risks of such an investment.
Angel Broking Pvt. Limited, its affiliates, directors, its proprietary trading and investment businesses may, from time to time, make
investment decisions that are inconsistent with or contradictory to the recommendations expressed herein. The views contained in this
document are those of the analyst, and the company may or may not subscribe to all the views expressed within.
Reports based on technical and derivative analysis center on studying charts of a stock's price movement, outstanding positions and
trading volume, as opposed to focusing on a company's fundamentals and, as such, may not match with a report on a company's
fundamentals.
The information in this document has been printed on the basis of publicly available information, internal data and other reliable
sources believed to be true, but we do not represent that it is accurate or complete and it should not be relied on as such, as this
document is for general guidance only. Angel Broking Pvt. Limited or any of its affiliates/ group companies shall not be in any way
responsible for any loss or damage that may arise to any person from any inadvertent error in the information contained in this report.
Angel Broking Pvt. Limited has not independently verified all the information contained within this document. Accordingly, we cannot
testify, nor make any representation or warranty, express or implied, to the accuracy, contents or data contained within this document.
While Angel Broking Pvt. Limited endeavours to update on a reasonable basis the information discussed in this material, there may be
regulatory, compliance, or other reasons that prevent us from doing so.
This document is being supplied to you solely for your information, and its contents, information or data may not be reproduced,
redistributed or passed on, directly or indirectly.
Angel Broking Pvt. Limited and its affiliates may seek to provide or have engaged in providing corporate finance, investment banking
or other advisory services in a merger or specific transaction to the companies referred to in this report, as on the date of this report or
in the past.
Neither Angel Broking Pvt. Limited, nor its directors, employees or affiliates shall be liable for any loss or damage that may arise from
or in connection with the use of this information.
Note: Please refer to the important `Stock Holding Disclosure' report on the Angel website (Research Section). Also, please refer to the
latest update on respective stocks for the disclosure status in respect of those stocks. Angel Broking Pvt. Limited and its affiliates may
have investment positions in the stocks recommended in this report.
Disclosure of Interest Statement
Century Plyboards India
1. Analyst ownership of the stock
No
2. Angel and its Group companies ownership of the stock
No
3. Angel and its Group companies' Directors ownership of the stock
No
4. Broking relationship with company covered
No
Note: We have not considered any Exposure below ` 1 lakh for Angel, its Group companies and Directors
Ratings (Returns):
Buy (> 15%)
Accumulate (5% to 15%)
Neutral (-5 to 5%)
Reduce (-5% to -15%)
Sell (< -15%)
February 14, 2018
8